Phone:
+85295718875
Email:
support@just-wonders.com

Phone:
+85295718875
Email:
support@just-wonders.com
Compare supplier defect rates for dropshipping with matching unit counts, inspection scope and observation windows before changing your purchasing source.
One supplier reports 2% defects and another reports 4%. That looks like an easy purchasing decision until you discover that the first counted customer complaints and the second counted problems found before dispatch. For a dropshipping store, supplier defect rates are useful only when the counts describe comparable goods, checks and time periods.
Before switching your next order to the apparently better source, ask for the numbers behind each percentage. Establish what counted as a defective unit, which units were eligible to be counted, and when the observation happened. You may find a genuine quality difference, a reporting difference, or too little evidence to rank the suppliers at all.
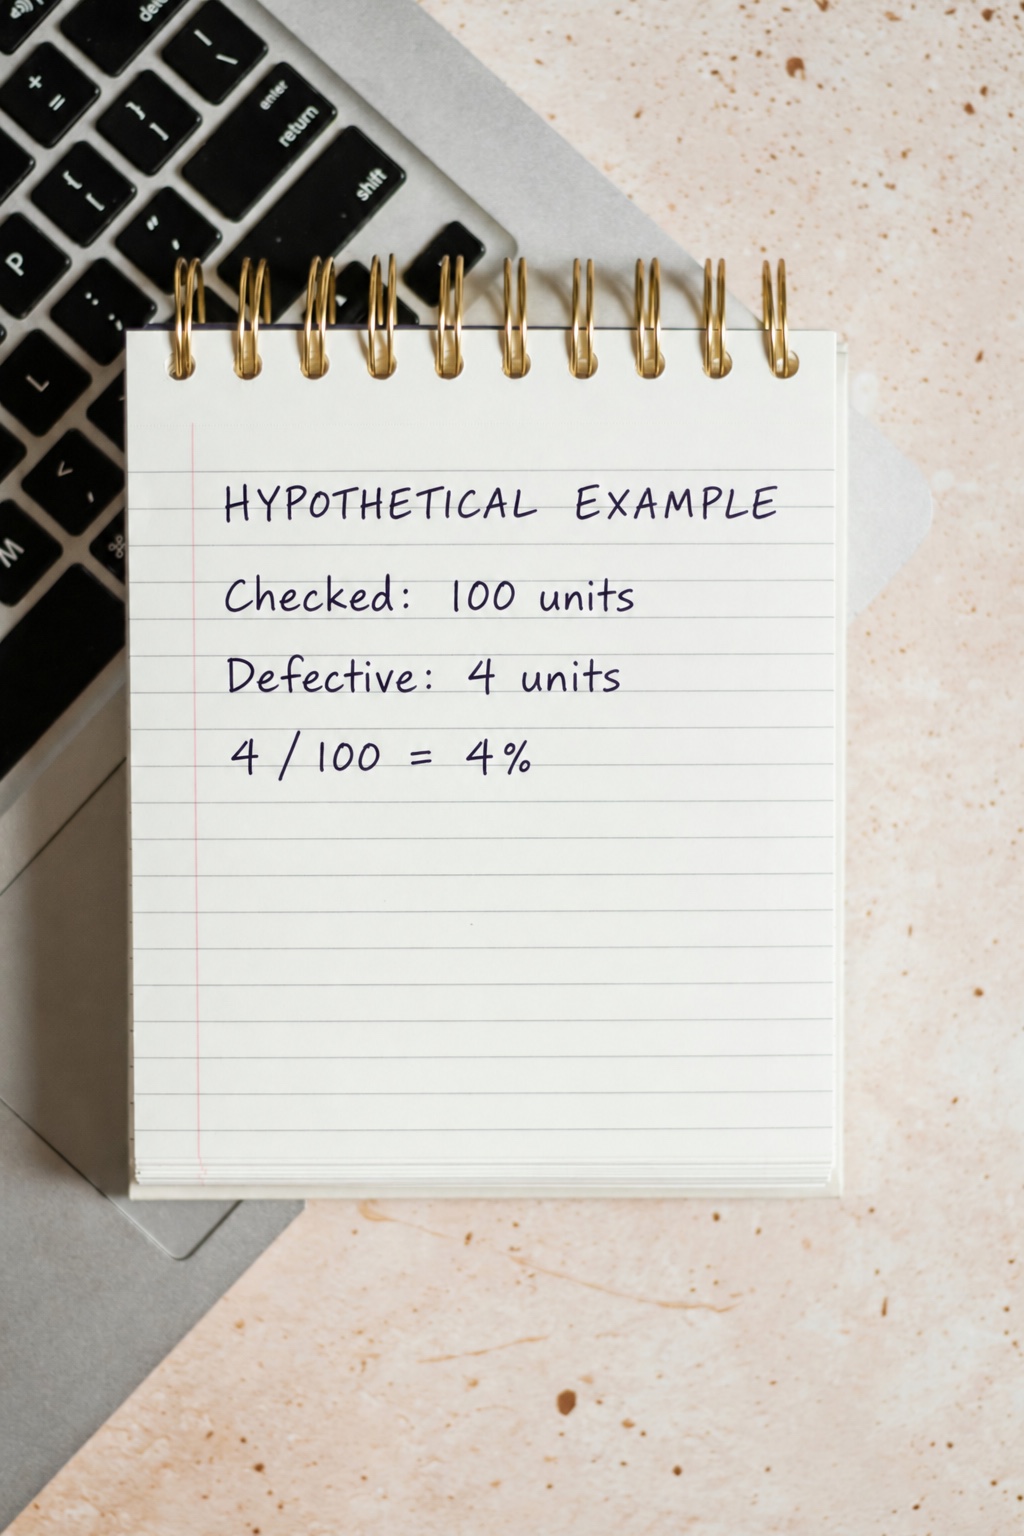
For a defined inspection, calculate the percentage as defective units divided by units inspected, multiplied by 100. Both counts must come from the same inspection scope. If 4 units fail among 100 checked, the observed rate is 4%. Do not divide those four findings by all 1,000 units received when the other 900 were not checked.
Write the fraction beside the percentage: 4/100 is more informative than 4% alone. Include the product version, batch, date and requirements used. A rate without those details is hard to reproduce and easy to misread when the next shipment contains a different mix of products.
Shopify’s supplier relationship management guide recommends considering defect or return rates alongside cost measures and making supplier performance expectations explicit. For a dropshipping seller, that means asking what the quality difference does to usable stock, customer remedies and fulfillment work, not choosing a supplier on a headline percentage alone.
The inspection sample size also matters to interpretation. One failure among 25 checked units and 40 failures among 1,000 checked units both produce 4%. They do not provide the same amount of information about ongoing performance. Keep the counts visible and ask a qualified quality specialist about sampling decisions rather than inventing a universal minimum from a blog example.
Check how those units were selected, too. A supplier’s specially prepared showroom samples and units chosen from an incoming customer-order batch are not the same evidence. Ask whether all variants were eligible for selection and whether any failed units were excluded from the report. A larger count cannot correct a selection process that systematically leaves out the goods you need to understand.
A rack containing different garments illustrates another boundary: each style can have different construction and inspection requirements. A knit with no buttons and a buttoned jacket should not be treated as interchangeable evidence merely because both belong to the clothing category. Compare the relevant products before comparing the supplier names.

Suppose one pouch has a broken zipper and an open seam. That is one defective unit with two recorded findings. If your numerator counts findings while your denominator counts pouches, you have calculated findings per unit, not the percentage of units with a defect. Keep both measures if they help, but label them differently.
For supplier defect rates based on affected units, count each inspected unit once even when several requirements fail. Keep the individual defect categories underneath that total so the supplier can investigate the zipper and seam separately. Otherwise, fixing one problem may appear to halve the number of defective products even though the same pouches remain unusable.
Agree the unit of measurement before inspecting a set. A pack of five buttons can be one sellable pack or five individual components, depending on the question. A missing button might make the pack unacceptable, but it does not mean five physical buttons were defective. State whether the record measures packs, components or customer orders.
The same discipline applies to support messages. A customer who emails twice about one damaged item has not reported two affected units. Connect repeated contacts to the original order and item before counting them. If the buyer received two units and only one has a confirmed fault, do not automatically mark both defective.
Physical differences are not automatically defects either. A two-hole button and a four-hole button are different configurations; either can be correct when it matches the approved requirement. A photograph helps identify that distinction, but it does not establish strength, material compliance or suitability for a particular garment.

An inspection measures what a defined check found at a particular stage. A customer complaint rate measures what buyers reported under your chosen counting rule. Those are related signals, not interchangeable supplier defect rates. Some faults are caught before shipping; others appear only after use, and some buyers never contact support.
For a customer-based measure, choose a clear group of delivered orders or units and a consistent observation window. Match the numerator to that group. Comparing complaints received this week with orders placed this week mixes older purchases with goods that may not even have arrived yet.
For example, compare two defined delivery groups after the same elapsed observation period, while retaining later reports separately. Describe that as your reporting convention, not a deadline that removes customer rights. A recent batch with no complaints may simply have had less time in customers’ hands.
Also separate reported condition from established cause. A crushed item may involve product construction, packaging, handling or more than one factor. Record the complaint promptly, then update the cause when evidence supports it. Do not automatically assign every refund, size preference or late parcel to a manufacturing-defect count.
Imagine two comparable inspections of the same ordinary accessory under the same requirements. In the first, 4 of 100 units are defective. In the second, 9 of 900 are defective. These are hypothetical teaching figures, not a supplier benchmark or UTS inspection result.
The separate observed rates are 4% and 1%. Their simple average is 2.5%, but that gives the small inspection as much influence as the large one. Across the combined checked units, the calculation is 13 divided by 1,000, or 1.3%. Add the compatible counts first, then calculate the percentage.
Even a correctly weighted total can hide a problem. Keep the 4/100 result visible beside the 9/900 result, with their batch identities. The combined 1.3% does not erase the first batch’s findings or authorize its release. A purchasing summary and a batch-release decision answer different questions.
When comparing supplier defect rates over time, check whether the product mix changed. A higher share of a difficult style can move the total without proving that every production process became worse. Review like-for-like product results before attributing a change to improved or deteriorating supplier performance.
Two suppliers can have the same affected-unit percentage while presenting very different risks. A minor appearance issue and a fault that makes an item unsafe should not become equivalent because each adds one unit to a count. Preserve your agreed severity categories and escalate safety concerns through the appropriate process independently of the overall rate.
Similarly, distinguish first inspection from inspection after correction. If ten units initially fail and the supplier repairs them successfully, the later result does not mean the first inspection found zero problems. Keep the initial findings, corrective work and verification linked. Repeatedly inspecting the same units should not inflate the denominator as though new goods arrived.
Supplier defect rates can therefore support a trend review without becoming a blanket acceptance rule. Use the actual inspection plan and product requirements for release decisions. A low monthly average is not permission to ship an identified faulty item, and an arbitrary percentage is not a substitute for applicable safety obligations.
If the underlying records cannot be reconstructed, label the comparison inconclusive rather than assigning a reassuring zero. Missing inspection data is not evidence that no defective goods existed. You can still discuss clearer reporting, arrange an appropriate check or limit a future purchasing commitment while the information improves. Protect already accepted customer orders through an explicit fulfillment plan rather than abruptly switching them to an unverified replacement source.
Keep the financial consequences separate from the physical defect count. Replacement purchasing, another parcel, refund handling and support work affect order economics, but adding their dollar amounts to a unit-based numerator makes the percentage meaningless. Maintain a quality measure and a cost view that can be traced to the same cases.
Before acting on supplier defect rates, request the smallest missing evidence that would change your decision. If the denominator is unclear, obtain the inspected-unit count. If one batch dominates the result, request its product breakdown. If reported faults lack a confirmed cause, investigate the relevant units and packaging instead of demanding an unsupported admission from the supplier.
UTS describes every-item inspection after warehouse arrival, with product-specific requirements included in the approved checklist. Use that discussion to agree what will be checked and which counts and findings you need for your purchasing review. The published workflow does not promise that every possible fault can be detected or that a particular statistical report is automatically available.
Finally, keep the comparison reproducible. Someone reviewing the next purchase should be able to identify the goods, requirements, original counts, observation stage and unresolved causes without reconstructing a chat history. Supplier defect rates earn their place in a dropshipping decision when they explain comparable evidence, expose the affected batches and guide a specific next action—not when they merely make one supplier look better on a dashboard.